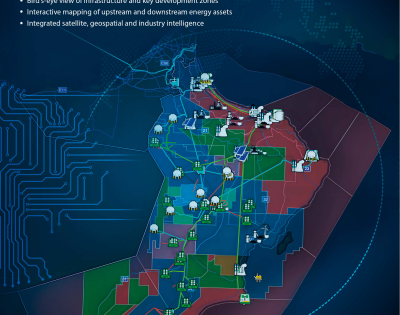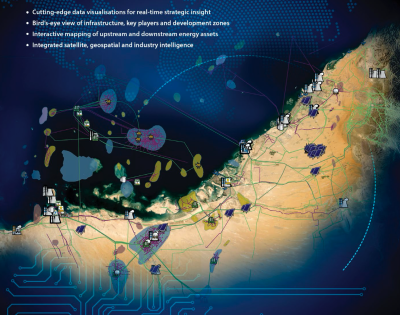


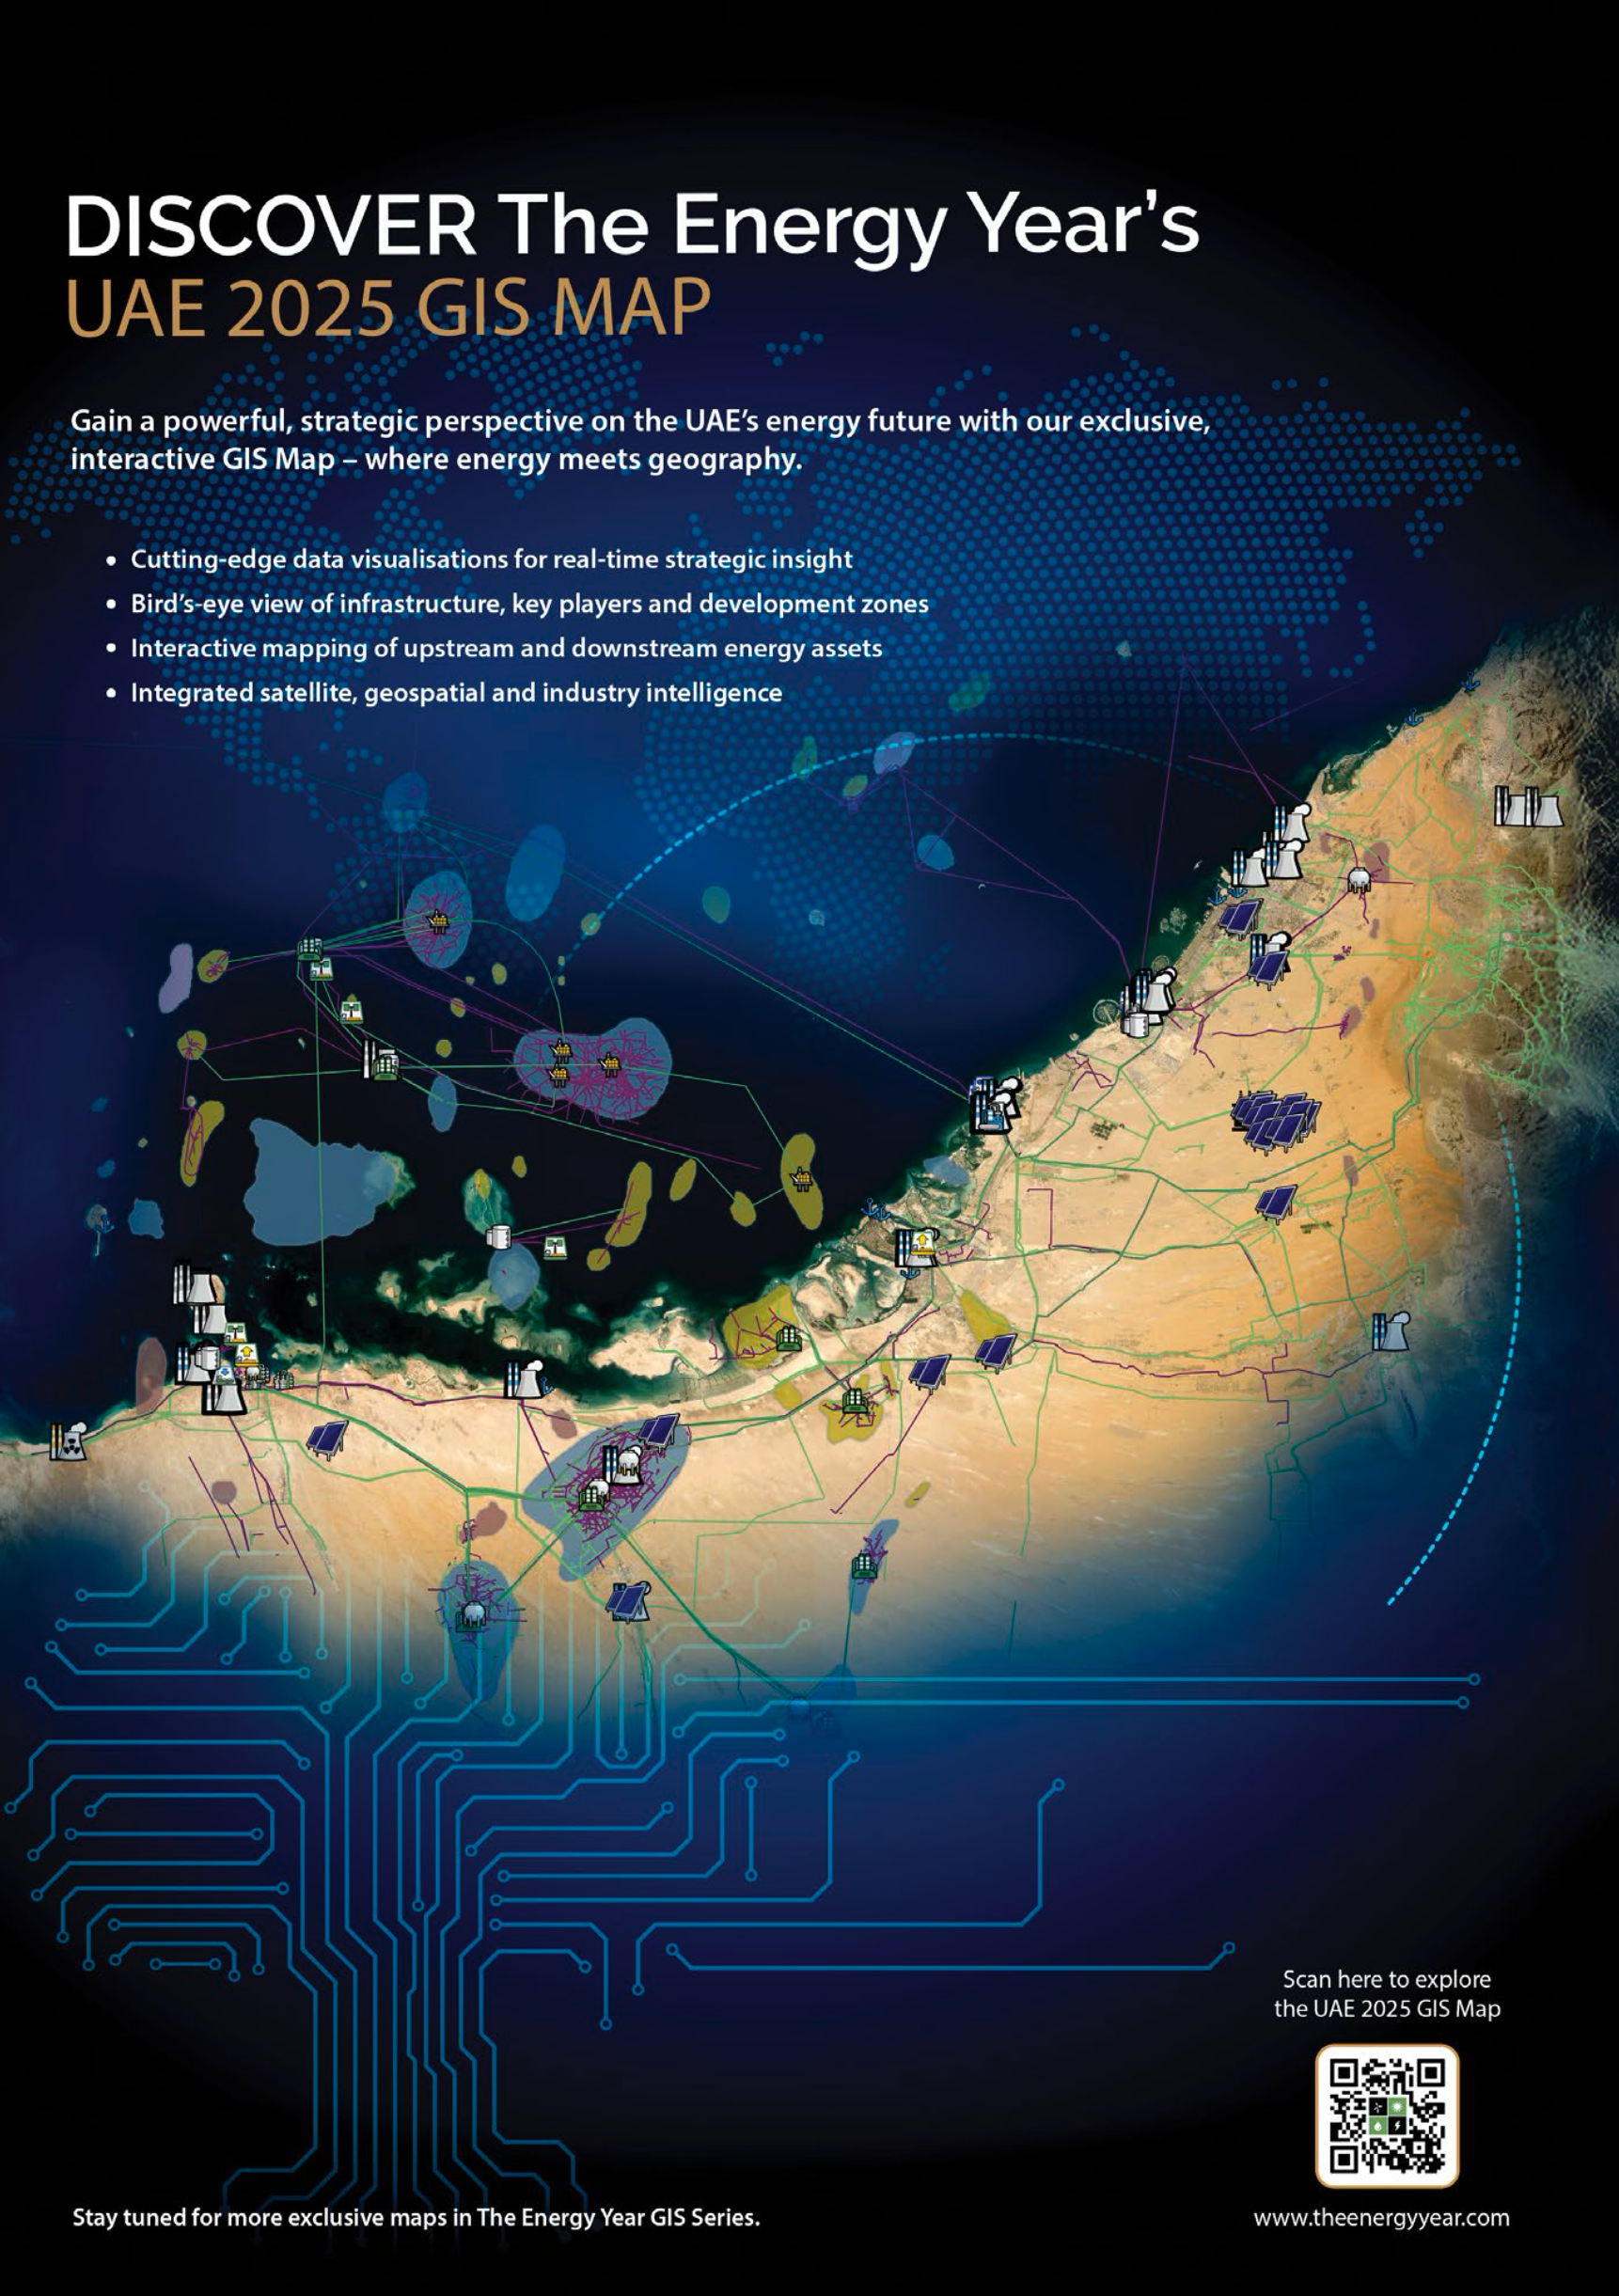
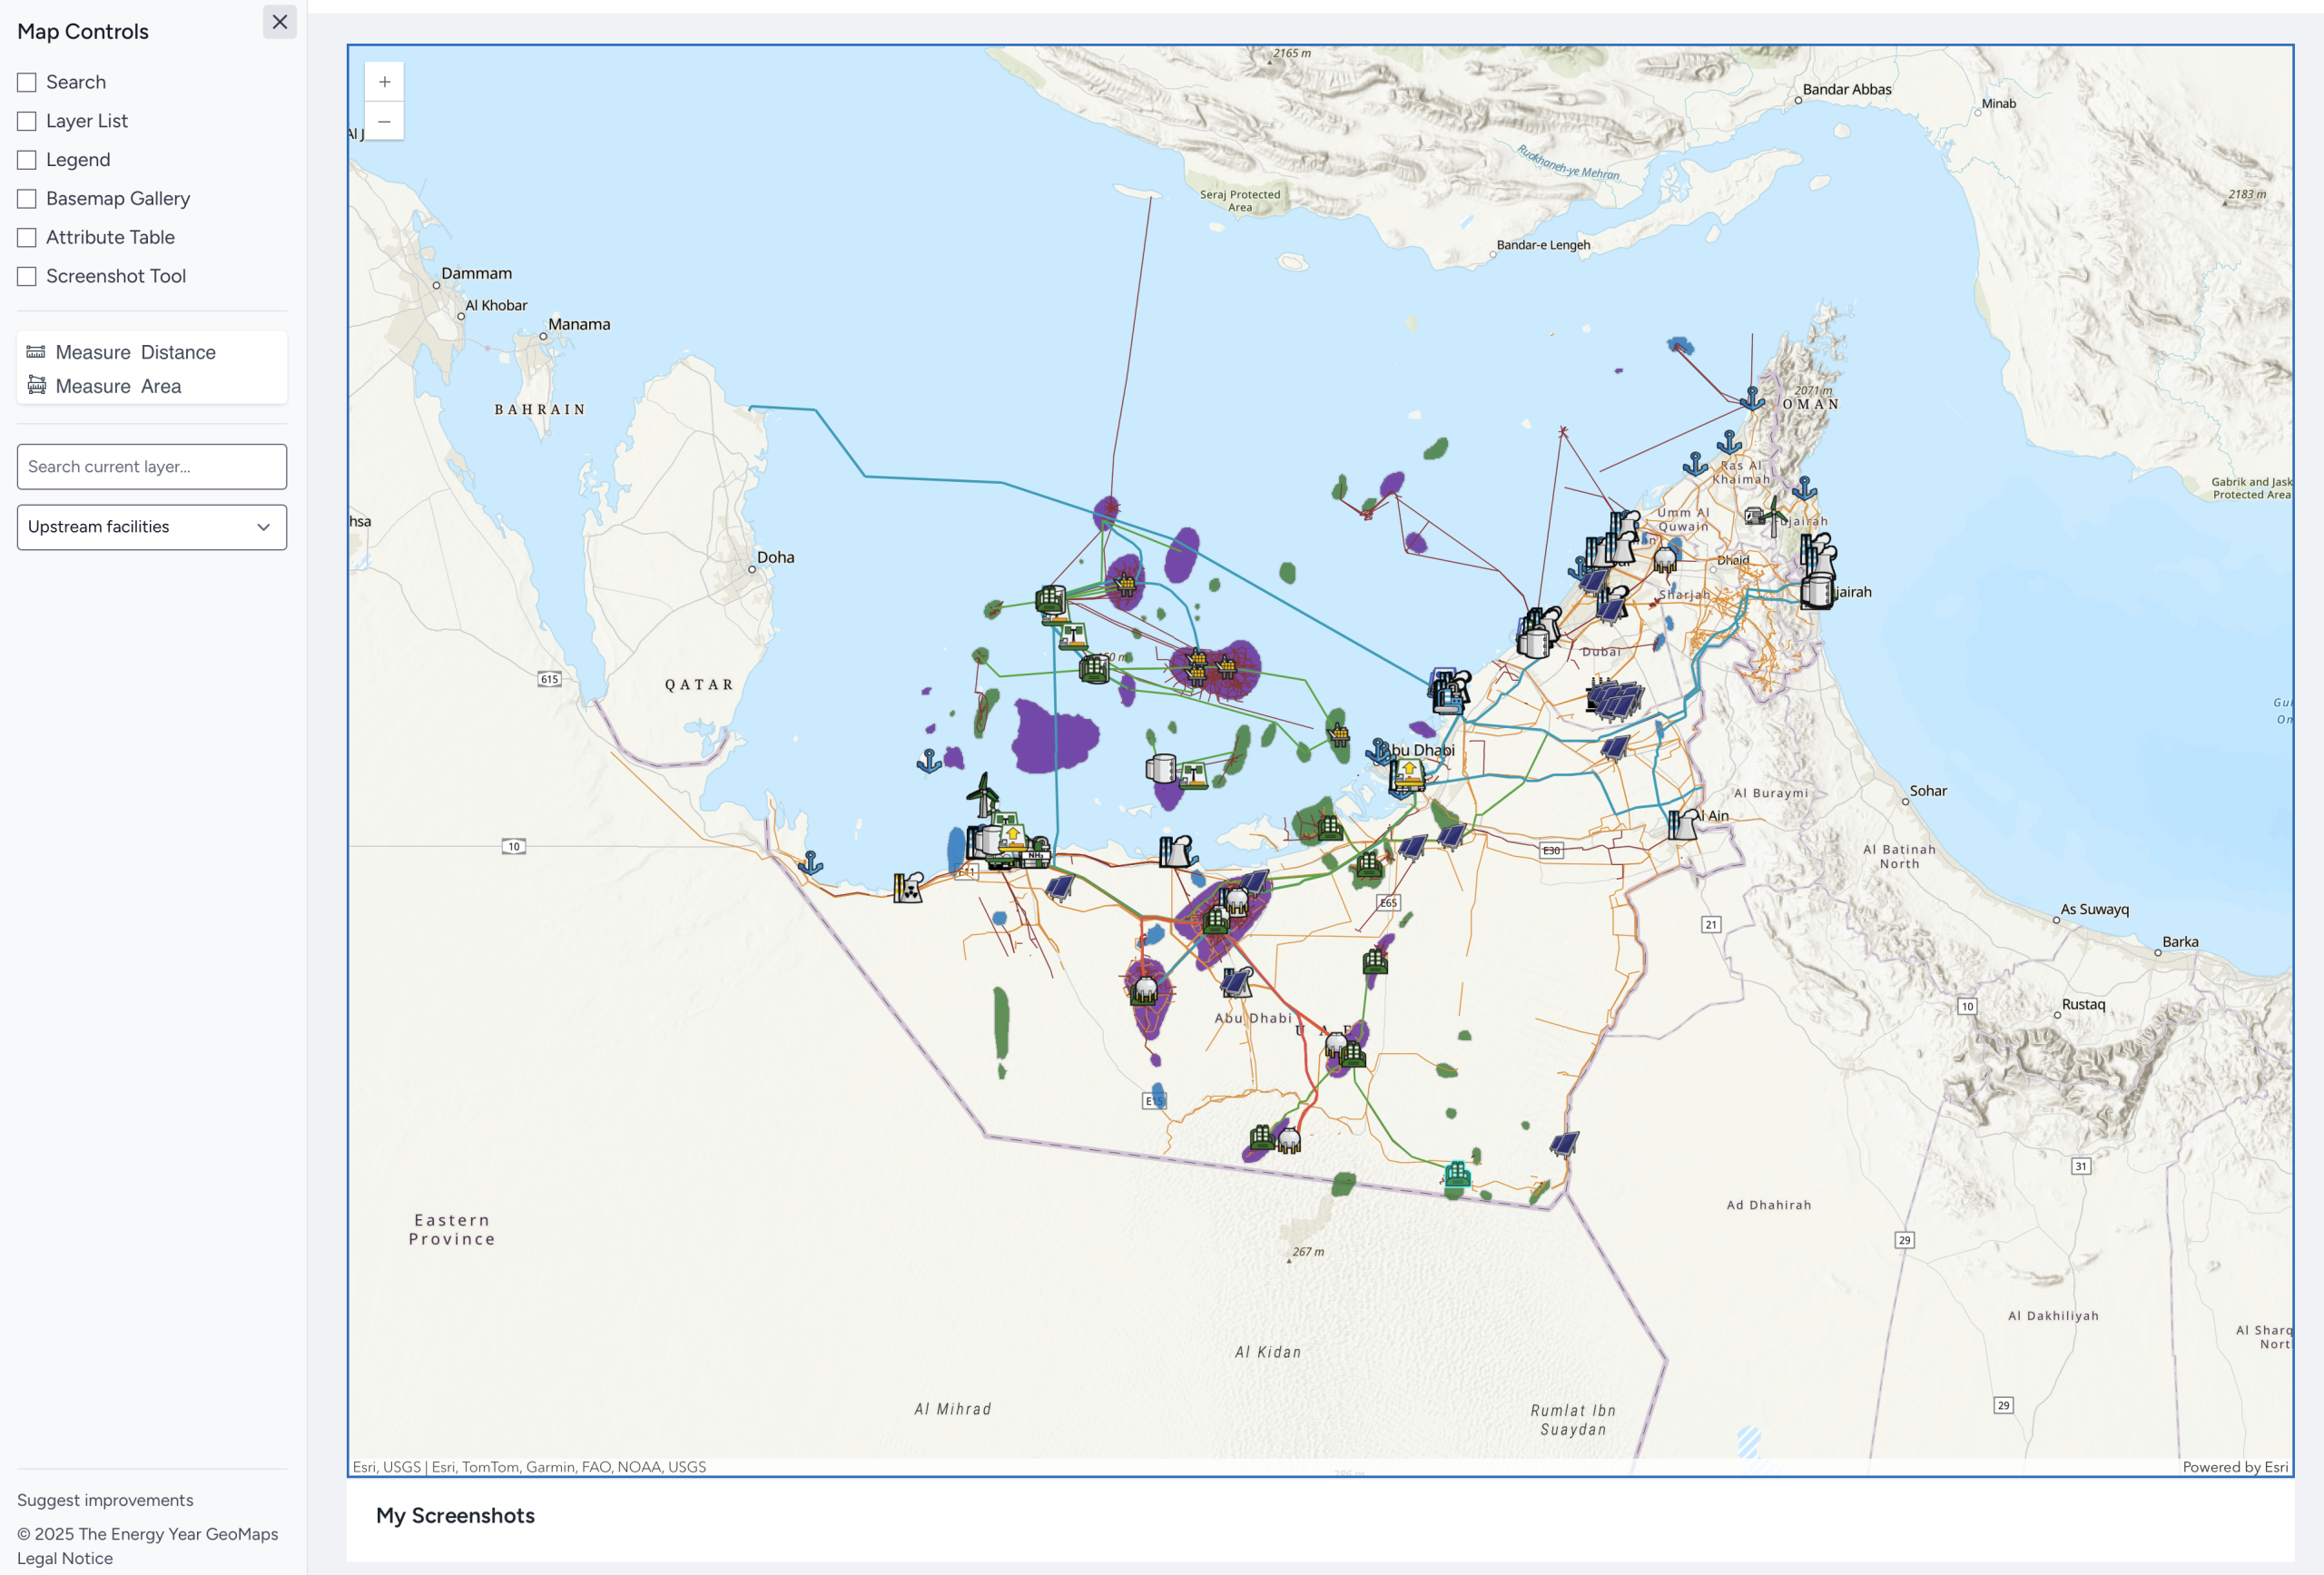

The Energy Year presents the first in its series of cutting-edge interactive maps. This multi-layered precision GIS map of the UAE details the country’s energy resources and infrastructure.
The map illustrates the major transformations that the UAE’s energy landscape is undergoing, driven by ADNOC’s ambitious P5 programme, which aims to increase national crude production capacity to 5 million bopd by 2027. This upstream expansion is complemented by strategic investments in midstream and downstream infrastructure, including new pipelines, processing hubs, and export terminals. At the same time, the sector is actively pursuing decarbonisation, with initiatives focused on carbon capture, low-emission fuels and electrification of operations, aligning with the UAE’s Net Zero 2050 target.
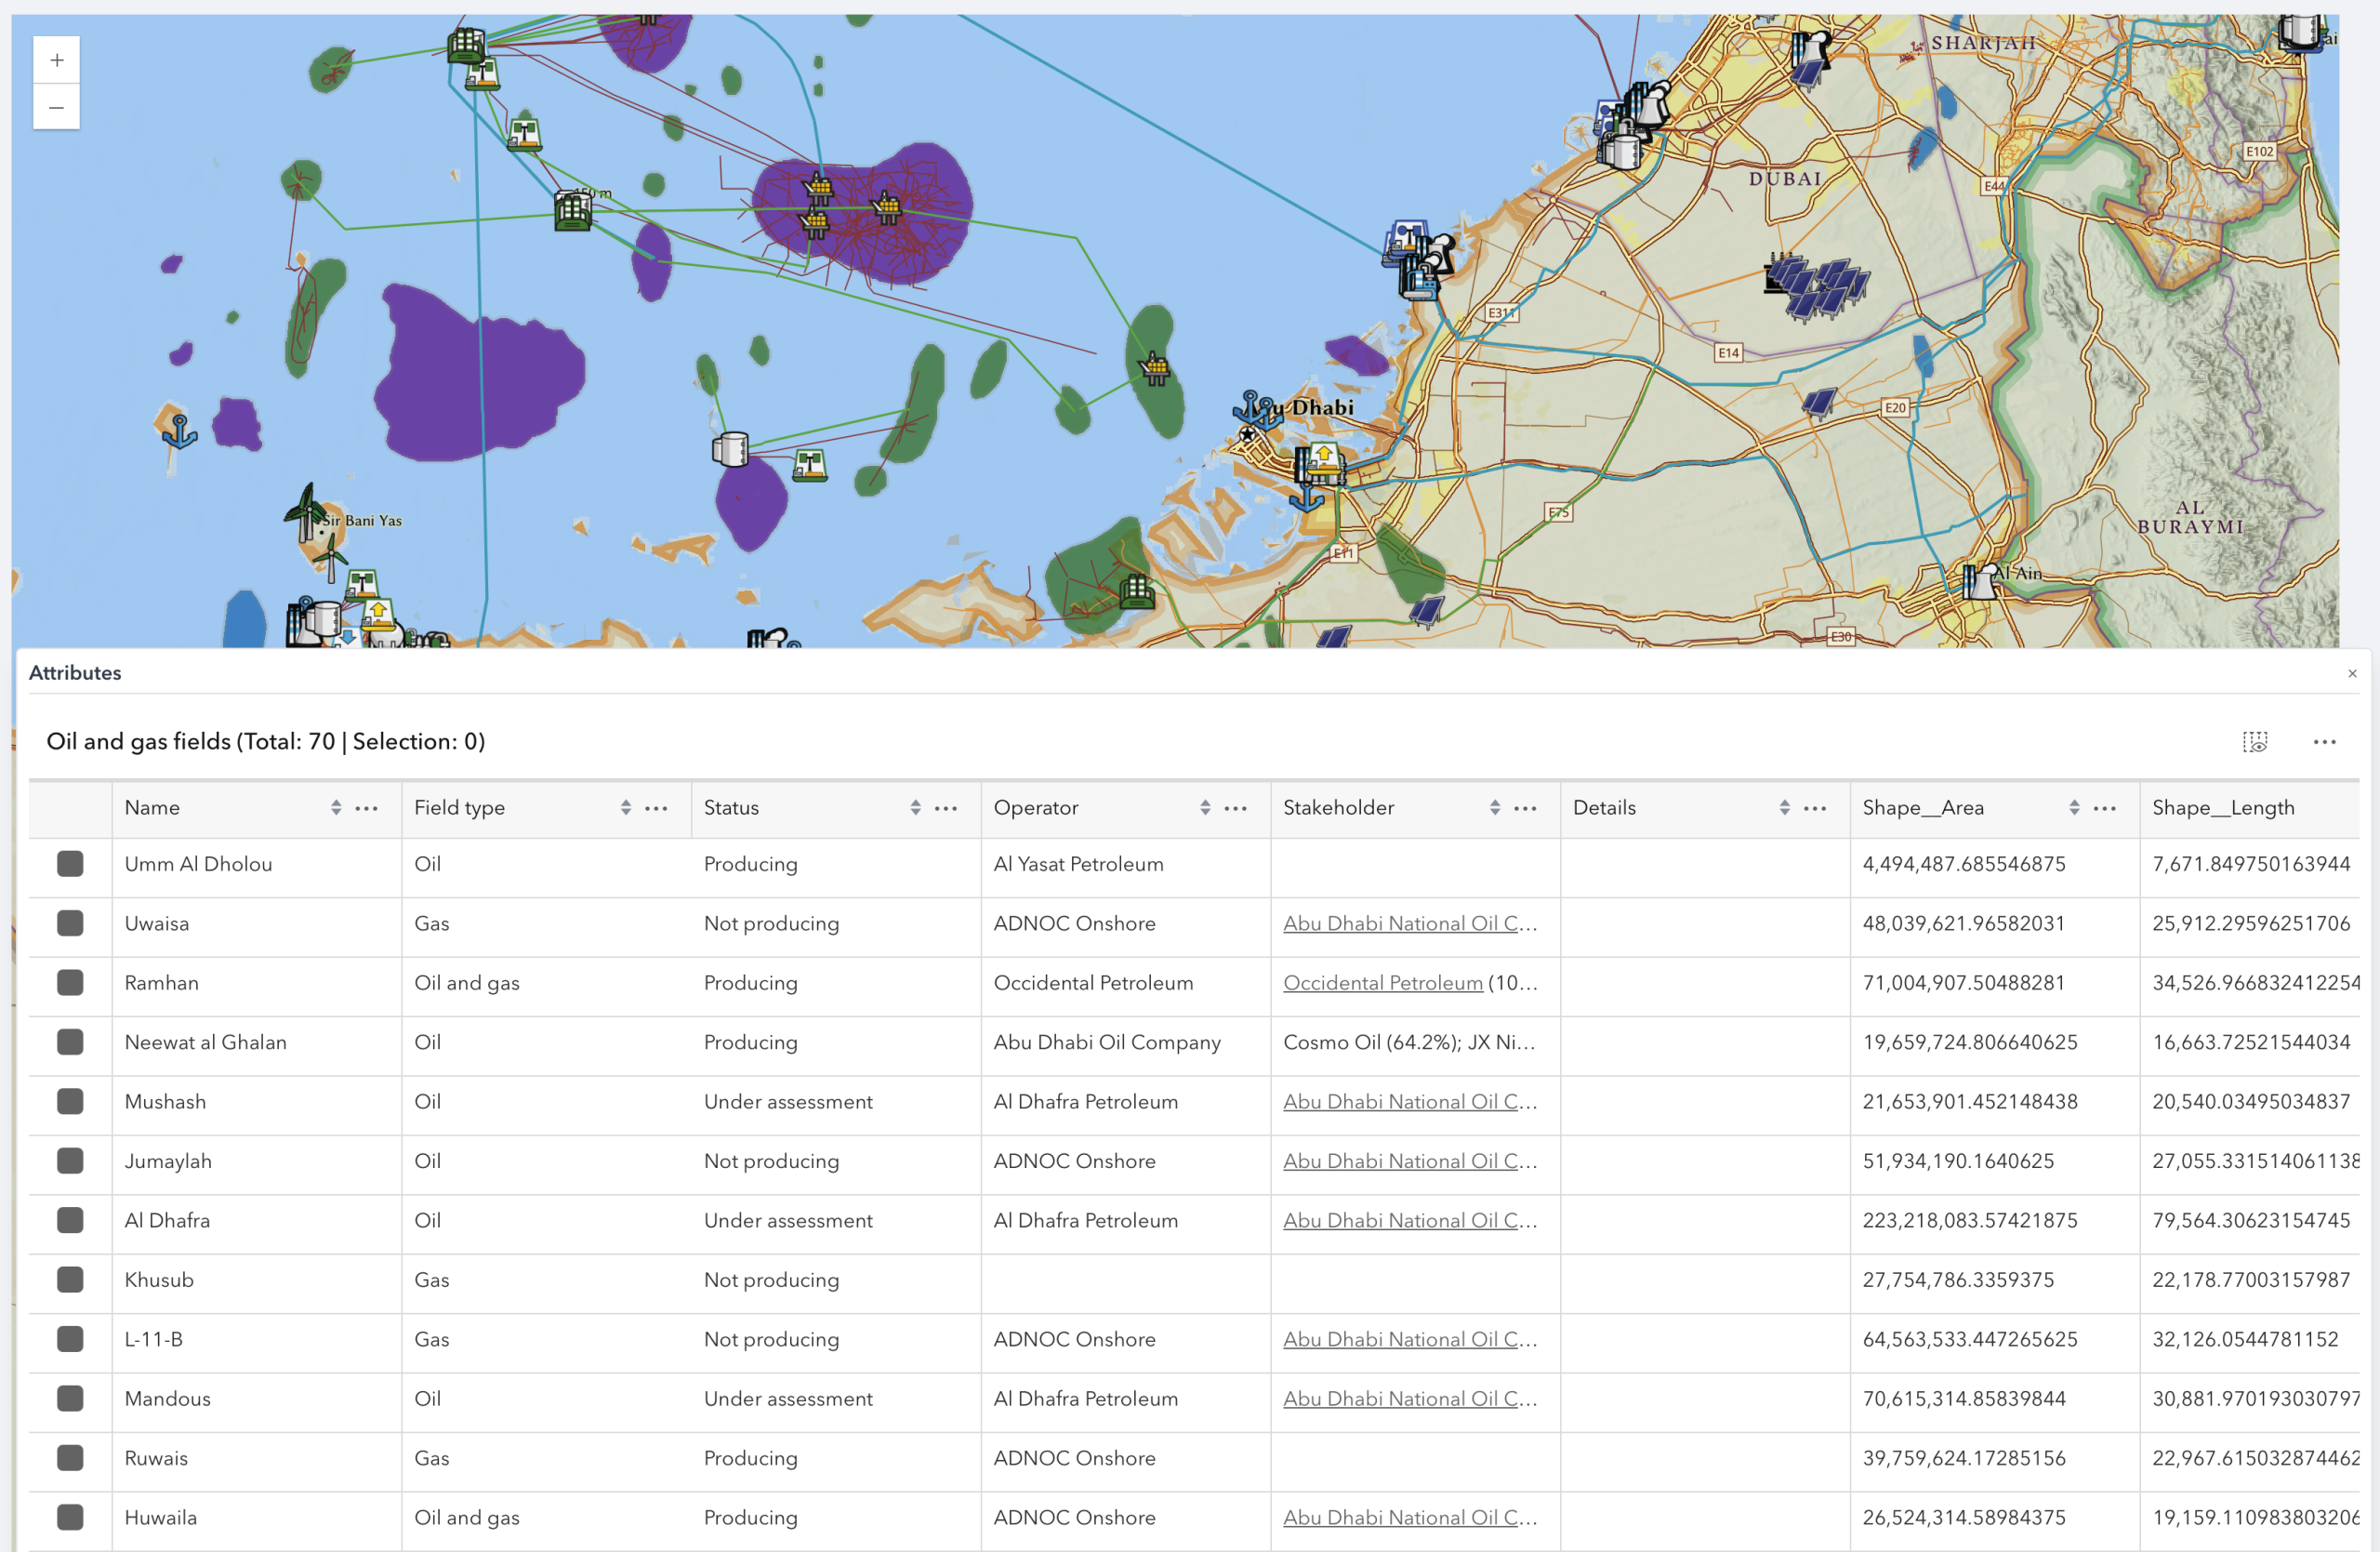
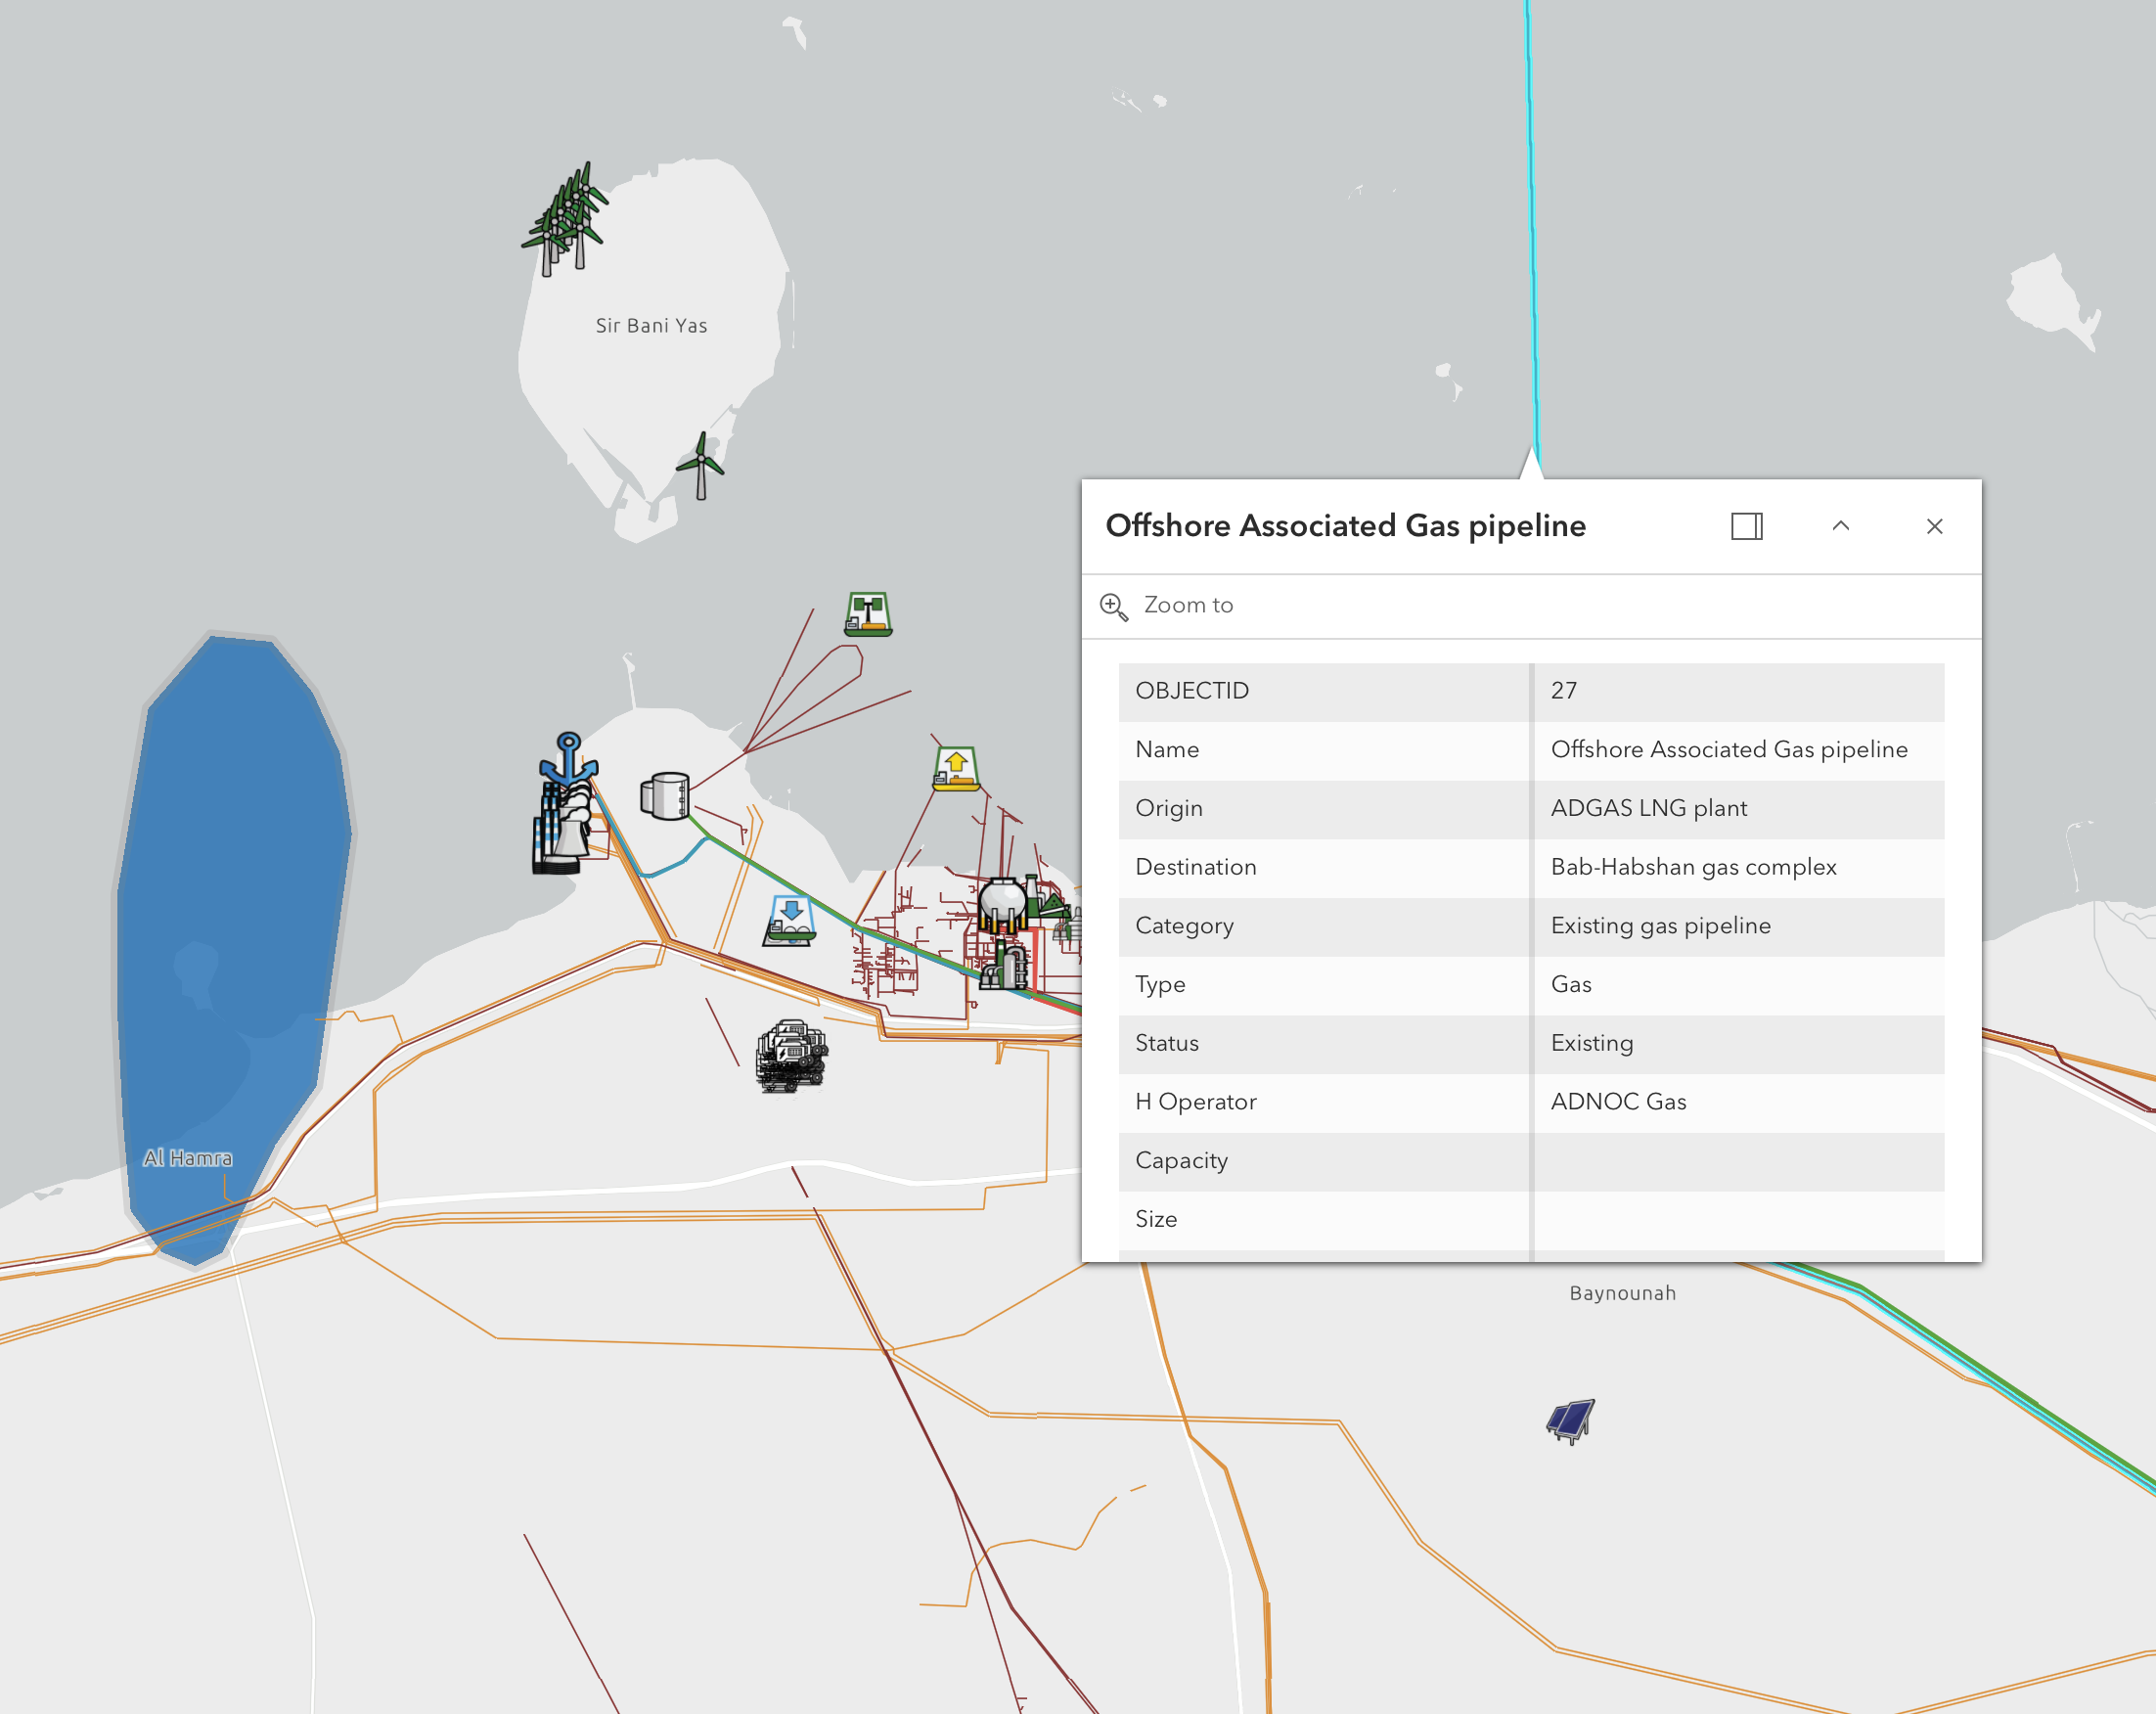
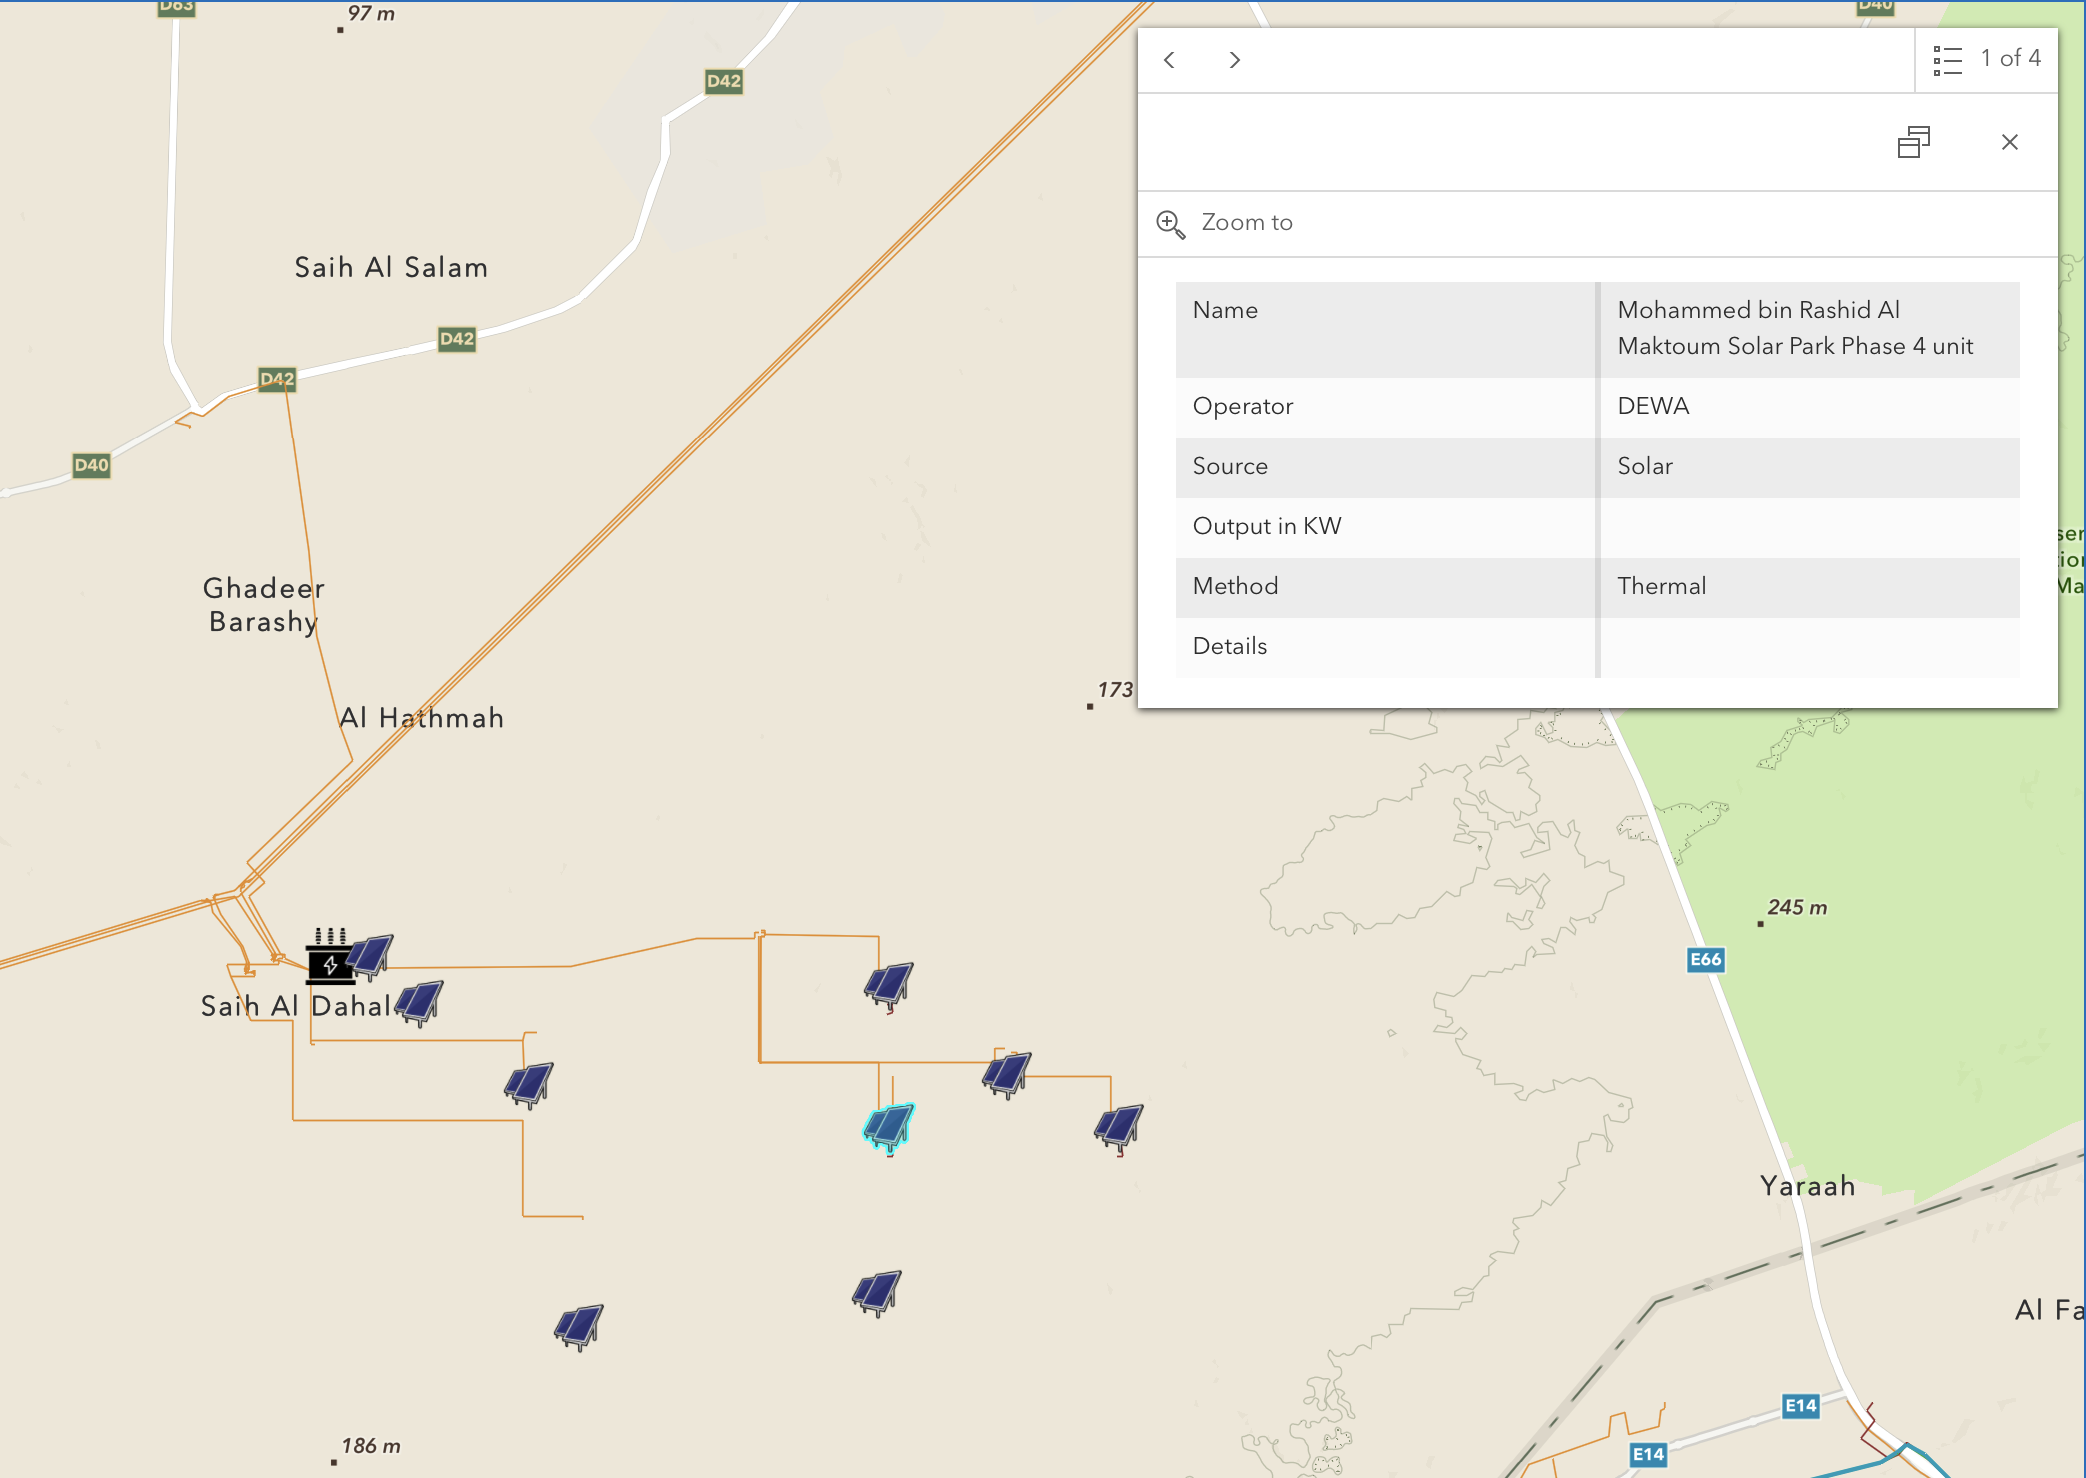
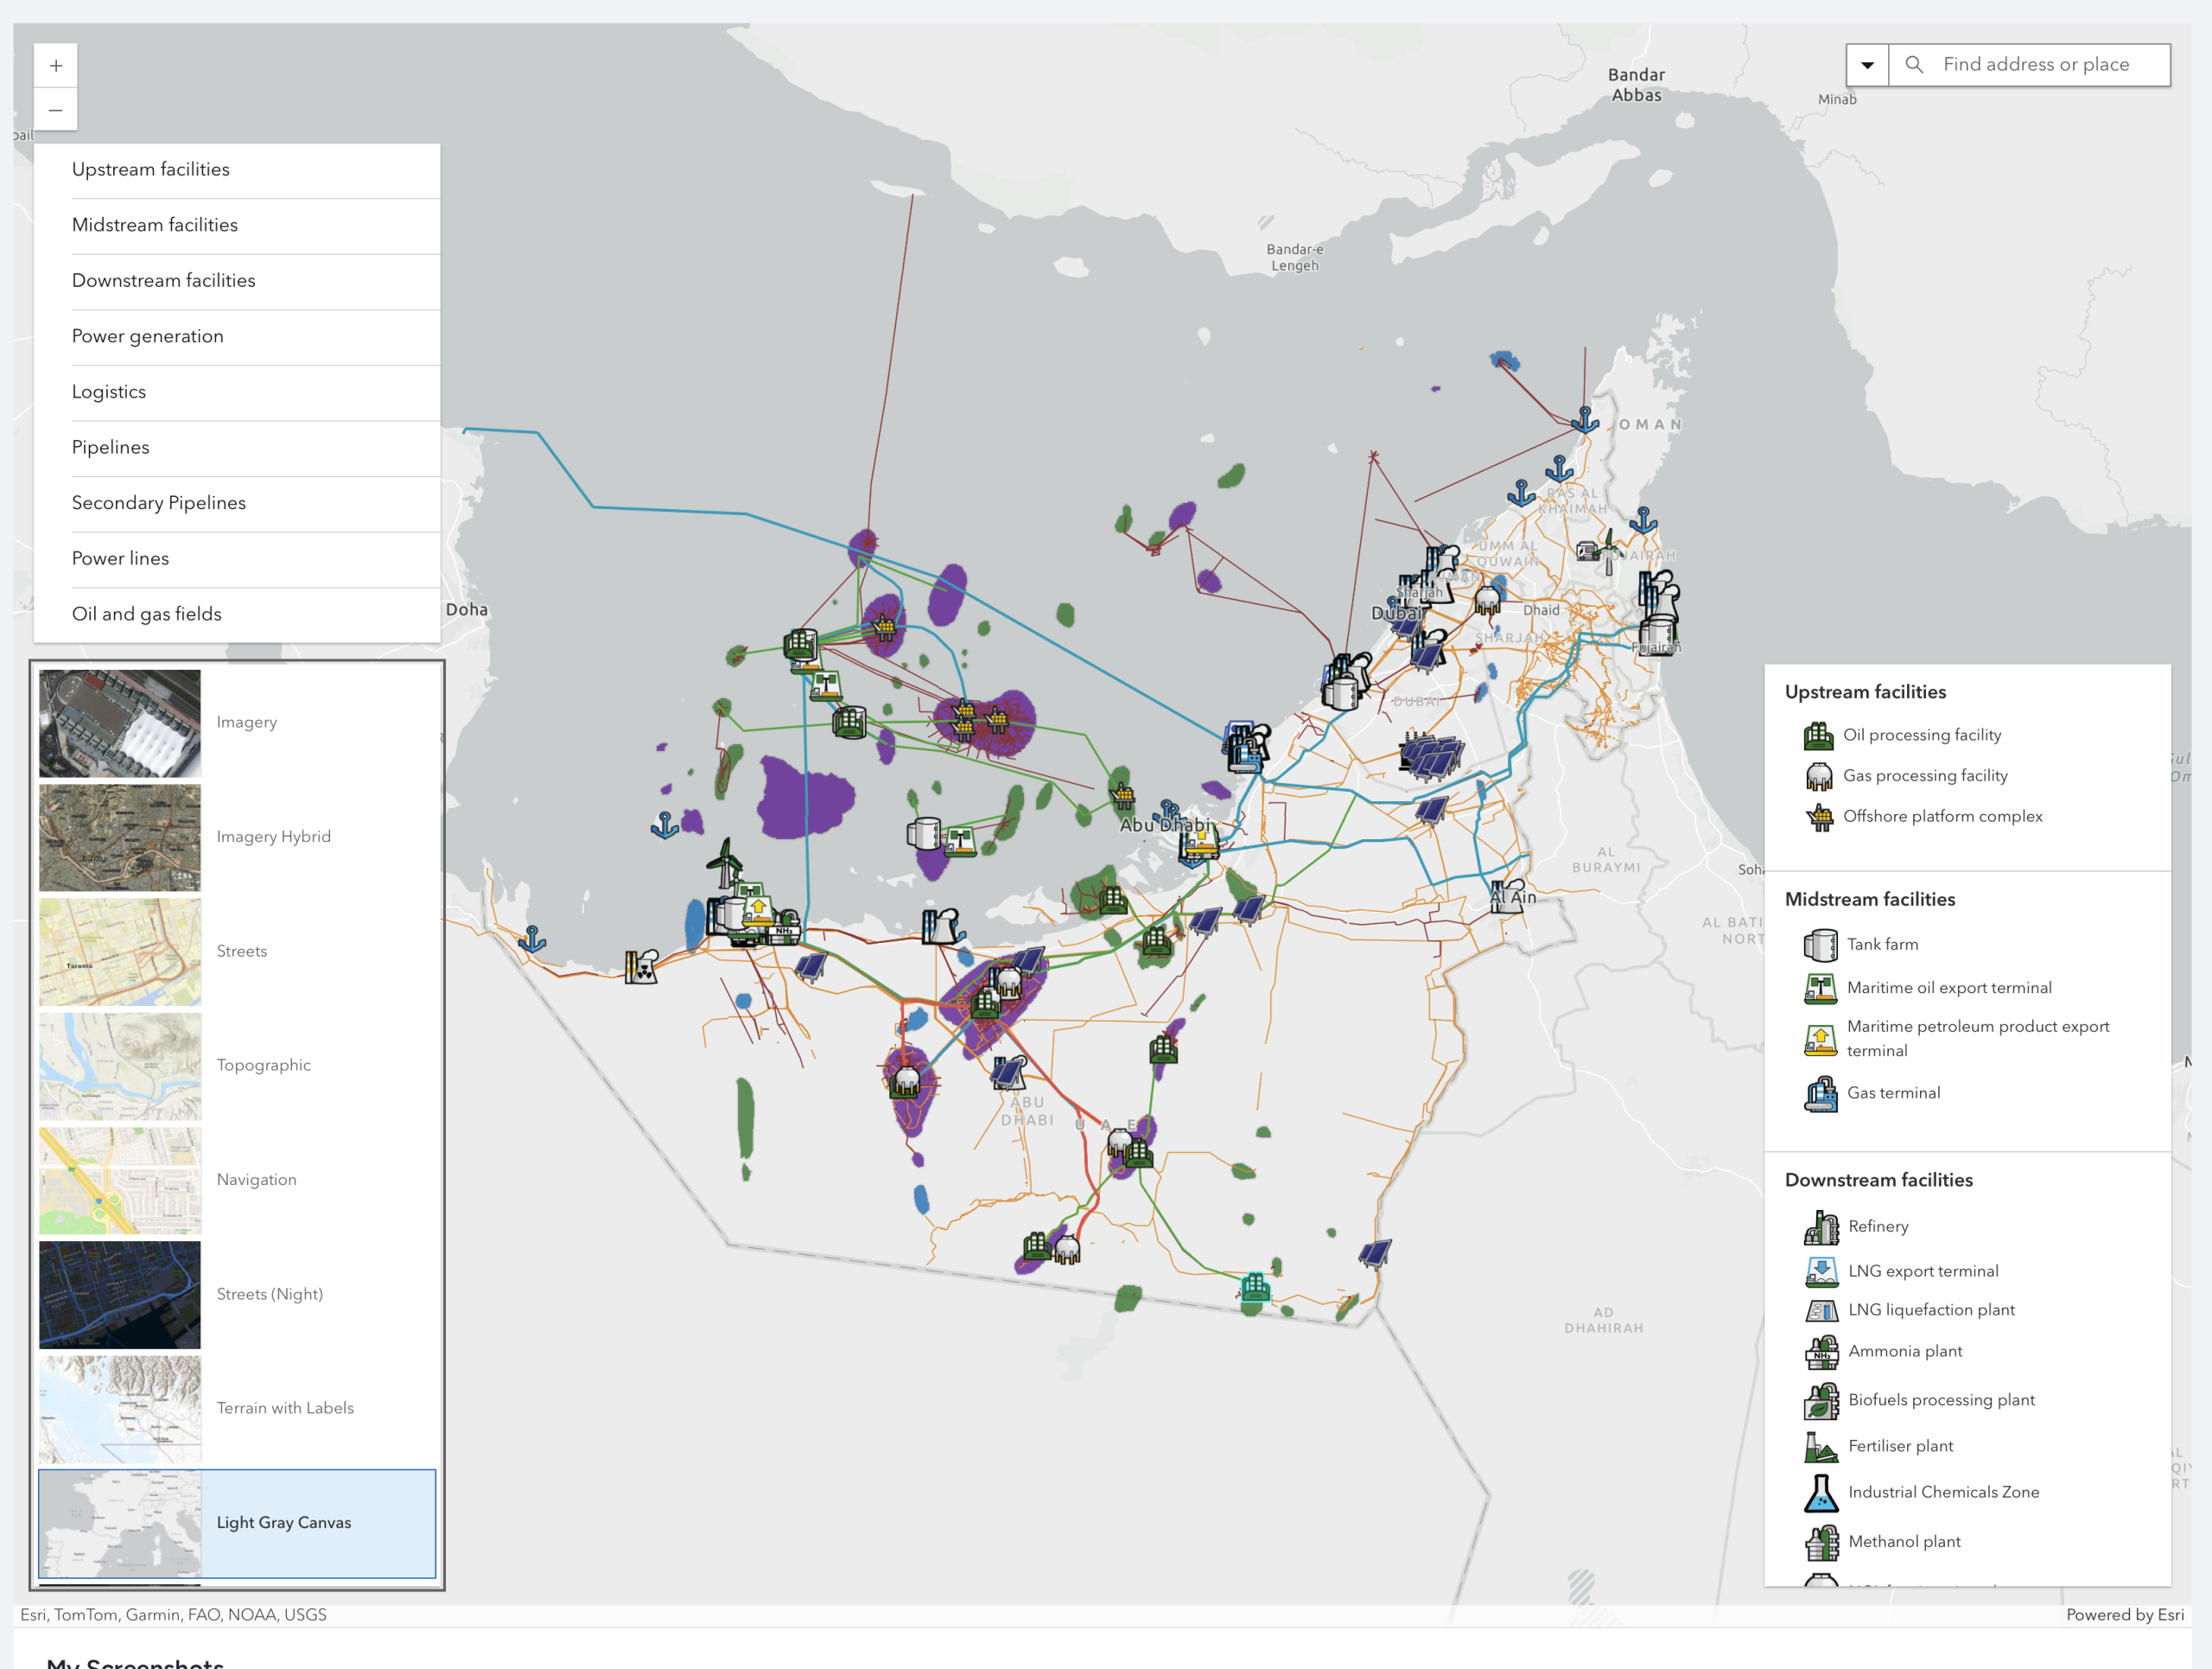
Detailed layers show oil and gasfields, pipelines, ports, electricity generation, electricity distribution and installations across the upstream, midstream and downstream. Satellite or terrain base maps show precise locations and routes of the items covered.
Layers can be switched on and off to change the maps focus while navigation tools permit a smooth exploration of the country’s assets.
The content is updated regularly by our team of researchers, and users can suggest improvements.
This interactive map highlights the breadth and complexity of the country’s evolving energy landscape. The dynamism of the UAE’s power sector is especially notable, as it integrates clean energy into the grid while supporting industrial growth and electrified oil and gas operations. The map enables a deeper understanding of how legacy assets and emerging technologies intersect across the value chain.